![[Wrapped Simulated phase (IC, London)]](wrapphase.gif)
|
The Atmosphere:
|
To maximize the efficiency of the adaptive optics systems, we plan to actively monitor the atmospheric conditions at the two Gemini sites. Nightly conditions will be monitored using a differential image motion monitor. This type of seeing monitor will be installed on both sites and serve as a baseline measure for queue scheduling of the adaptive optics systems.
Mauna Kea
Some work on Mauna Kea has already been completed. A set of SCIDAR data taken by Francois Roddier et al. (1990 SPIE Vol 1236 485) on Mauna Kea is illustrated below. This figure was taken from a paper by Ellerbroek and Tyler (1997).
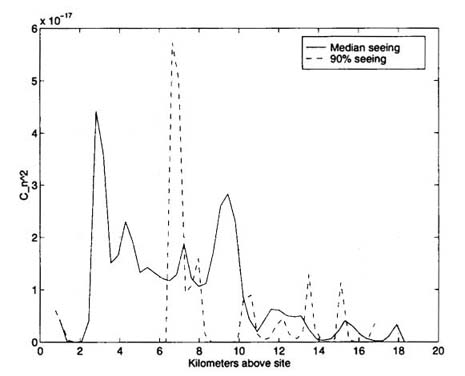
Median seeing conditions on Mauna Kea are taken to be ro ~ 0.23 meters at 0.55 microns. The 10% best seeing conditions are taken to be ro ~ 0.40 meters.
Cerro Pachon
The Cerro Pachon site characterization campaign took place in 1998 and consisted of four Generalized-SCIDAR runs at CTIO (January,April,June,October), a number of bimonthly balloon launches at Cerro Pachon, and a week of Generalized Seeing Monitor observations at Pachon. The campaign was conducted by Jean Vernin from the University of Nice. For details, check out the final report in the AO documentation archive page.
The following is a summary of the atmospheric conditions found in
the study. All parameters are specified at a wavelength of 0.55
microns.
| G-SCIDAR1 | G-SCIDAR2 | Balloon | GSM | |
| Seeing [arcsec] | 0.85 | 0.89 | 0.67 | 0.83 |
| Isoplanatic angle [arcsec] | 2.1 | 2.1 | 2.1 | 2.8 |
| Coherence time [milliseconds] | 4.8 | 5.4 | 4.9 | - |
| Focal-anisoplanatism parameter, d0 [meters] | 3.7 | 3.8 | - | - |
| Optimal Conjugation height3 [km above site] | 2.7 | 2.5 | - | - |
| Wavefront Outer scale [meters] | - | - | - | 36 |
| Scintillation [%] | 17.3 | 17.2 | 15.7 | 1.9 |
1
Generalized SCIDAR results where ambigous zero-altitude turbulence is attributed to dome seeing and removed.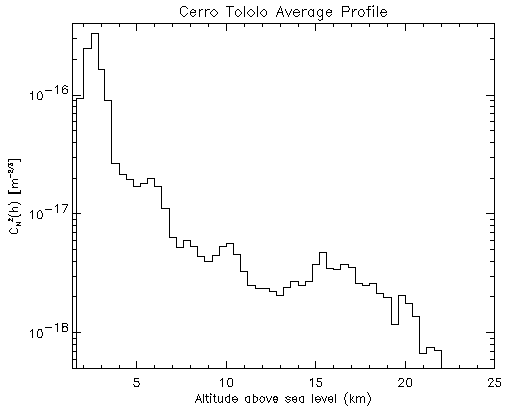
The figure above illustrates a CN2 profile generated by combining a
few hundred profiles with near median r0. Most of the turbulence
is near the ground. A discrete layer fit to the profile was made
by fitting 1-d guassians to the profile. The following table
gives the relative strength of the layers and the wind
velocities.
| Altitude (km a.s.l.) | Relative Cn2 strength | Vwind (m/s) |
| 2.7 | 0.647 | 6.6 |
| 4.5 | 0.08 | 12.4 |
| 6.0 | 0.119 | 8.0 |
| 8.5 | 0.035 | 33.7 |
| 10.1 | 0.025 | 23.2 |
| 15.8 | 0.08 | 22.2 |
| 18.5 | 0.015 | 8.0 |
The brightness of a sodium laser guide star depends linearly on the sodium column density above the sites. The seasonal variations appear to be similiar in that they peak in the respective winter months. Sporadic layers appear and move on timescales as short as minutes.
Below are listed a few of the studies which have been done at or
near the two Gemini Telescope sites. Feel free to send us more
references to add to this list.
| Location | Technique | Reference | Title |
| Mauna Kea | Lidar | Kwon et al. (1988), J. Geo. Res., 93(D11), 14199. | Lidar Observations of Sporadic Sodium Layers at Mauna Kea Observatory |
| Mauna Kea | Lidar | Papen et al. (19??), ? | ? |
| Sao Jose dos Campos (23 S, 46 W) | Lidar | Simonich et al. (1979), J. Geo Res., 84(A4), 1443. | Mesopheric Sodium Layer at 23 degrees South : Noctural and Seasonal Variations |
| Sao Jose dos Campos (23 S, 46 W) | Lidar | Clemesha et al. (1982), J. Geo Res., 87(A1), 181. | The Diurnal variation of atmospheric sodium |
| Sao Jose dos Campos (23 S, 46 W) | Lidar | Clemesha et al. (1982), J. Geo Res., 87(A1), 181. | Characteristics of the Sporadic Sodium Layer at 23 degrees South |
![]()
![]()
![]()
Page compiled by Mark Chun. Last update April 18, 2000; Francois Rigaut